
How Much Value Have Denver Homes Really Lost Since 2022?

Denver home prices have declined modestly from their 2022 peak, but inflation tells a much bigger story. REcolorado data shows the median closed price fell approximately 3.7% between May 2022 and October 2026. Adjusting that comparison for Denver-area inflation produces a decline of approximately 17.3% in purchasing-power terms. But what does that actually mean for your home's value and your equity?

Here's the thing. When homeowners ask me how much value their house has lost since 2022, I usually have to answer that question with another question: What kind of value are we talking about?
Are we talking about what the house could actually sell for today? How that compares with its value during the bidding wars of 2022? Or how much purchasing power that money represents after several years of inflation? Those are three different questions, and understanding the difference is important when you're making financial decisions involving your home.
I spend a lot of time evaluating properties, and I'll tell you, looking at one number rarely gives us the complete picture. A homeowner in Broomfield might have a property that's held its value relatively well, while a condo owner in Thornton could be facing a very different market. And two homeowners with nearly identical houses could walk away from a sale with completely different amounts of money. So, let's run the numbers and look at what's actually happened in Denver Metro since 2022.
How Much Have Denver Home Prices Actually Fallen Since 2022?
According to REcolorado, the Denver Metro median closed home price declined from $615,000 in May 2022 to $592,000 in October 2026, a decrease of approximately 3.7%. However, median prices reflect the particular homes sold during each reporting period. They don't necessarily tell us how much an individual property has appreciated or depreciated.
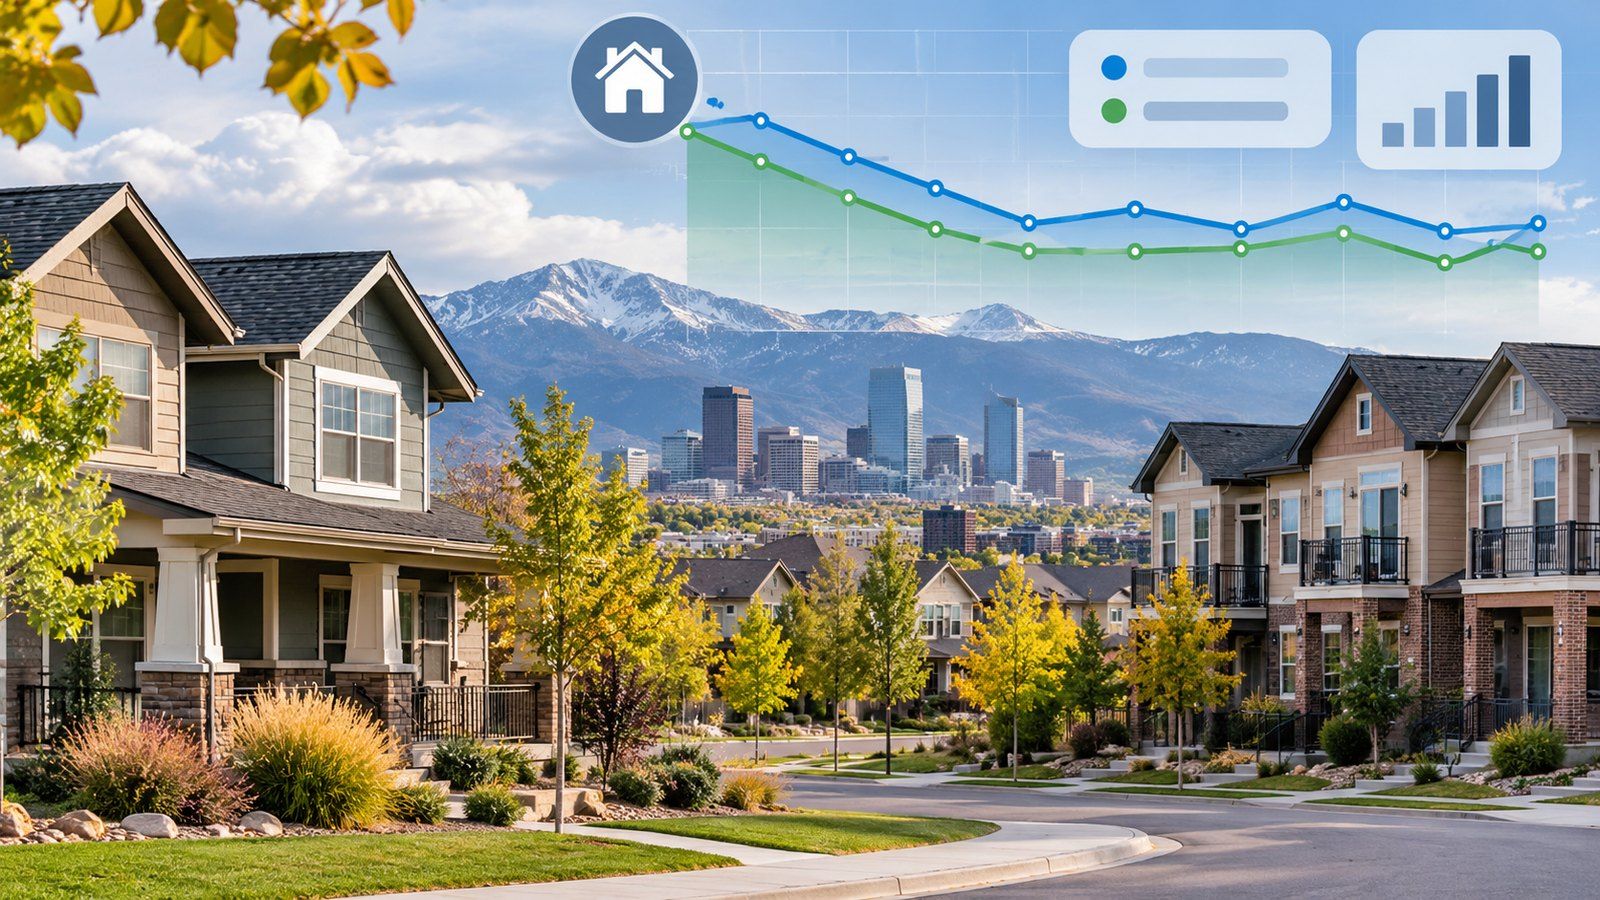
If we stopped at that 3.7% figure, you might think Denver's housing correction has been relatively small. But there are different ways to measure home-price changes, and those methods don't always produce the same results.
For example, the Federal Housing Finance Agency (FHFA) publishes a House Price Index that measures changes in property values over time. Unlike a monthly median selling price, the FHFA index uses repeat-transaction information, including sales and appraisal data in its all-transactions series.
The FHFA Denver-Aurora-Lakewood all-transactions index registered 495.04 in the second quarter of 2022 and 492.50 in the second quarter of 2026. That's a nominal decline of approximately 0.5%, compared with the 3.7% decline in REcolorado's median-price comparison.
How Do Different Home Price Measurements Compare?
| Home-price measurement | Earlier period | Latest period | Change |
|---|---|---|---|
| REcolorado median closed price | $615,000 May 2022 |
$592,000 Oct. 2026 |
−3.7% |
| FHFA all-transactions price index | 495.04 Q2 2022 |
492.50 Q2 2026 |
−0.5% |
Sources: REcolorado Denver Metro Market Watch and FHFA Denver-Aurora-Lakewood All-Transactions House Price Index. These measurements cover different property populations, methodologies, and ending dates.
Now, neither number is necessarily wrong. They're measuring different things. REcolorado's median price is affected by the mix of homes that sold during a particular month. The FHFA index attempts to measure price changes over time using properties with transaction histories, and its latest comparison here ends in June rather than October 2026.
You can review the FHFA Denver House Price Index through the Federal Reserve Bank of St. Louis or the October 2026 REcolorado market report.
The important takeaway is that neither statistic tells us exactly what your house is worth today. We still need to look at your property, its condition, its location, and what comparable homes are selling for.
How Has Inflation Affected the Real Value of Denver Homes?
Inflation has reduced the purchasing power of home values since 2022. According to the Bureau of Labor Statistics, consumer prices in the Denver area increased approximately 16.4% between May 2022 and September 2026. That means a home can retain much of its nominal dollar value while representing considerably less purchasing power than it did four years earlier.

Here's where the numbers get interesting. Suppose you had a home worth $500,000 in May 2022. If that house experienced the same approximate 3.7% decline reflected in REcolorado's median-price comparison, its hypothetical current value would be around $481,300.
That's a decline of approximately $18,700 in actual dollars. But when we adjust that $481,300 for the 16.4% increase in Denver-area consumer prices, its equivalent value in 2022 purchasing power is approximately $413,300.
What Happened to a Hypothetical $500,000 Home?
| Measurement | Amount |
|---|---|
| Hypothetical home value in May 2022 | $500,000 |
| Current nominal value using median-price change | $481,300 |
| Nominal dollar decline | $18,700 |
| Inflation-adjusted value in 2022 dollars | $413,300 |
| Inflation-adjusted decline | Approximately 17.3% |
Illustrative calculation using REcolorado median-price changes and Bureau of Labor Statistics Denver-area CPI data. This is not a property-specific market valuation.
Now, I want to make one thing very clear. I'm not suggesting that a $481,300 home would only sell for $413,300 today. The lower number measures purchasing power in 2022 dollars, not what a buyer would necessarily pay for the house today. But it does show why looking only at nominal home prices can be misleading when we're discussing how an asset has performed over time.
I explained this relationship between inflation, mortgage rates, and buyer affordability in more detail in my previous article, Is Inflation Driving Denver Home Prices Down? Understanding the Housing Correction Since 2022.
For this discussion, I want to focus on something more personal: what these changes mean for your property's actual value, your equity, and what you could walk away with if you sold.
Have Denver Condos, Townhomes, and Detached Houses Lost the Same Value?
No. Denver's housing correction has affected different property types differently. According to the October 2026 Denver Metro Association of REALTORS report, detached homes had a median closed price of $645,000, down 0.64% year over year. Attached homes, including condos and townhomes, had a median price of $375,000, down 3.25%, and generally took longer to sell.

This is one of the reasons I don't believe homeowners should make decisions based solely on a Denver Metro headline. The market for a detached house in Arvada can look quite different from the market for a condo in Westminster or a townhome in Thornton.
According to the Denver Metro Association of REALTORS October 2026 Market Trends Report, detached homes spent a median of 26 days in the MLS, compared with 48 days for attached properties. The Colorado Association of REALTORS also reported that Broomfield-area condos and townhomes faced additional pressure, with prices down approximately 8% in its October market commentary.
That doesn't mean every condo is declining in value or that every detached home is holding steady. But it does tell us that different segments of the market are experiencing different conditions.
HOA dues, insurance costs, assessments, financing requirements, inventory, and property condition can all influence what buyers are willing and able to pay. In today's affordability environment, those additional expenses can become deciding factors.
When I evaluate a property, I want to understand the competition in that particular neighborhood. What are similar homes selling for? How long are they taking to sell? Are sellers making concessions? Does the property need improvements to compete? Those answers are much more useful than assuming every home in Broomfield, Arvada, Westminster, or Thornton has experienced the same percentage change.
Does a Lower Home Value Mean I've Lost Equity?
Not necessarily. Home value and equity are related, but they're not the same thing. Your equity is generally the current market value of your home minus the debt secured by it. Mortgage principal payments may increase your equity even when home prices remain flat or decline. What you actually receive from selling also depends on transaction expenses and other costs.

This is where I think the conversation gets particularly important. Let's say we have two homeowners with nearly identical houses. For this example, both properties have an estimated current market value of $481,300. Homeowner A owes $350,000 on their mortgage, while Homeowner B owes $420,000. Same estimated selling price. Very different financial situations.
Let's assume illustrative combined selling expenses of 6%. That's not a standard commission rate or a quote for a particular transaction; it's simply a way to compare the numbers. Actual commissions are negotiable, and every transaction has different expenses.
How Much Could Each Homeowner Actually Walk Away With?
| Financial comparison | Homeowner A | Homeowner B |
|---|---|---|
| Estimated selling price | $481,300 | $481,300 |
| Mortgage payoff | $350,000 | $420,000 |
| Gross home equity | $131,300 | $61,300 |
| Illustrative selling expenses (6%) | $28,878 | $28,878 |
| Estimated net proceeds | $102,422 | $32,422 |
Hypothetical examples, not actual client transactions. Figures exclude additional liens, repairs, concessions, prorated expenses, taxes, and other possible costs.
Look at that difference. Homeowner A could walk away with approximately $102,000 before any additional expenses, while Homeowner B could receive approximately $32,000. That's a $70,000 difference, even though both homes have the same estimated market value.
This is why I spend so much time building financial scenarios for my clients. I don't want to focus exclusively on the selling price or what the property might have been worth four years ago. I want to know how much equity you have today, what it will cost to sell, and what you're actually going to put in your bank account.
There's another consideration here. If you've owned your property for several years and have been making regular mortgage payments, you may have reduced your principal balance. That can help build equity even when home prices aren't increasing. On the other hand, somebody who purchased near the 2022 peak with a small down payment could have considerably less financial flexibility if they need to sell today.
So, when a homeowner tells me they're concerned because their house has lost value, I don't immediately focus on that headline percentage. I want to understand their mortgage balance, what the property could realistically sell for, and the expenses involved in getting it sold.
Home value matters. Equity matters. But what you actually walk away with matters most when you're planning a sale.
Why Might My Home Sell for Less Than an Online Estimate or Previous Appraisal?
Online estimates, appraisals, and actual selling prices may differ because they're based on different information, assumptions, and valuation dates. An automated estimate may not fully account for property condition or recent neighborhood competition. A professional appraisal estimates market value as of a specific date, but neither an appraisal nor an online estimate guarantees what a buyer will ultimately pay.
I have this conversation with homeowners regularly. Somebody looks up their house online and sees an estimated value of $550,000. Maybe they had an appraisal a couple of years ago that supported a similar number, so naturally that's what they believe their property should sell for.
But today's buyer might be comparing that house against several other properties with newer finishes, better landscaping, lower HOA expenses, or more competitive asking prices. If those competing properties offer better value, that $550,000 estimate might not reflect what buyers are currently willing to pay.
I'm not saying online estimates or appraisals aren't useful. They absolutely can be. But they're pieces of information, not guarantees.
When I evaluate a property, I look at recent comparable sales, current listings, properties under contract, and the home's condition. I also want to understand whether improvements could help us achieve a better financial result. Maybe it needs paint, flooring, landscaping, or just a little spit shine. Sometimes spending money makes sense. Sometimes it doesn't.
The question is whether those improvements would generate enough additional proceeds to justify their cost.
We'll explore this subject in much greater detail in another article in this series, because understanding the difference between an appraisal, an online estimate, and a realistic selling price deserves its own discussion.
For now, the important point is that your home's current value needs to be supported by today's market evidence, not simply by what it was worth in 2022.
How Can I Find Out What My Denver Home Is Worth and What I'd Actually Net?
Determining your home's current value requires reviewing recent comparable sales, competing listings, property condition, location, and buyer demand. But knowing what the home could sell for is only part of the equation. To make an informed decision, we also need to account for mortgage balances, preparation costs, transaction expenses, and your expected net proceeds.

At the end of the day, I don't want you making a decision based solely on what Denver home prices have done since 2022. Those numbers help us understand the broader market, but they don't tell the full story of your property or your financial situation.
When I sit down with homeowners, I want to understand what they're trying to accomplish. Maybe they're relocating for a job, downsizing, helping Mom or Dad move into assisted living, or simply wondering whether now is the right time to sell.
Then we evaluate the house and put together some options. We might compare selling as-is, making targeted improvements, completing a larger renovation, or waiting. Each option has different costs, timelines, risks, and potential returns. The goal is to compare those scenarios so you can decide which one makes the most sense.
Sometimes the numbers tell us that selling today is the right move. Sometimes they tell us that waiting is better. And sometimes a relatively small investment in preparing the property can make a meaningful difference in what the seller walks away with.
That's why I always come back to the numbers. The housing market has changed since 2022, and inflation has affected purchasing power, but the right decision depends on your particular circumstances.
You don't need to predict the next housing boom or the next housing crash. You need to understand your options and make a decision that works for you.
I'm Scott Jensen with ReZion Realty, brokered by eXp Realty. I help homeowners throughout Broomfield, Arvada, Westminster, Thornton, and the greater Denver Metro area evaluate their properties, compare selling strategies, and put together practical plans.
If you're wondering what your home could realistically sell for today, how much equity you have, or what you'd actually walk away with after a sale, let's sit down and run the numbers.
Scott Jensen | ReZion Realty, brokered by eXp Realty
Call or text: 720-352-7704
Email: scott@rezion.us
Market information reflects published data available through November 17, 2026. Financial examples are illustrative and are not property-specific appraisals, actual client results, or guarantees of selling prices. Consult appropriate financial, lending, tax, or legal professionals regarding your individual circumstances.
Categories
Recent Posts